December 8, 2009
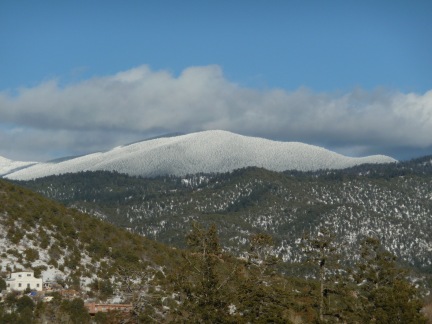
As I was shoveling a path to my office early last week, the snow (about 4 1/2 inches) seemed particularly dense. Typing WeatherData[“KSAF”, “TotalPrecipitation”, {{2009, 12, 1}, {2009, 12, 31}, “Day”}] onto a Mathematica page showed that, melted down, Santa Fe received 0.19 inches of precipitation. But that was down at the airport. Amy C. Lewis, a hydrologist who maintains the weather station in Seton Village, just south of town, says she measured 0.42 inches of water from the storm. She has also sent me data filling in the blanks of the Seton chart I compiled earlier this month and has provided measurements from the Santa Fe 2 station dating all the way back to November 1867! She gathered the numbers the old-fashioned way, by poring over the hard copy reports in the State Library. I didn’t even know those records existed.
Another reader, William Henry Mee, has sent me a spreadsheet of his own measurements on County Road 44-A in the San Marcos area. I have included all this new information in what I now will call the Ultimate Santa Fe Precipitation Chart. (You can also download it as a spreadsheet.)
This morning I used the new data to compute 10-year averages dating back a century:
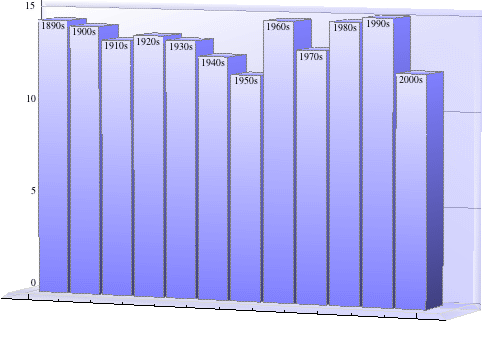
Santa Fe precipitation by decade
On the chart, “1890s” means 1889 to 1898, “1900s” means 1899 to 1908, and so forth. That way the righthand bar represents the most recent full decade of precipitation. You can see how over the last 40 years Santa Fe became accustomed to wetter weather. The population of the county grew like moss, from 38,153 in 1950 to 143,937 by 2008:
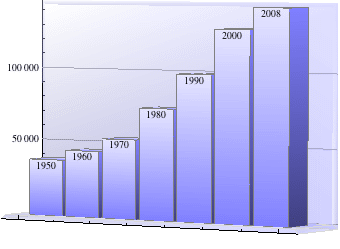
Santa Fe County population by decade
But unlike moss it kept on growing, even as the weather dried up.
