A couple of months ago, as an early Christmas present to myself, I bought a copy of Mathematica, the powerful software package invented by Steven Wolfram, a physicist/entrepreneur I’ve written about in the Times and interviewed on bloggingheads.tv. Once I’d downloaded the program, I wasn’t quite sure what to do with it, so I started playing around. I typed an arbitrary trigonometric formula — Tan[x]/Tan [y], {x, -5, 5}, {y, -5, 5} — into a Mathematica notebook page and asked for a three-dimensional plot. It looked like a good place to go hiking: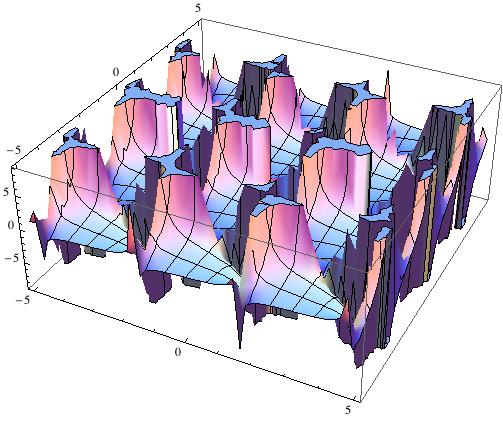
In Mathematica (but not here) the image becomes a virtual object that you can grab by the corner and twirl around, exploring every nook and cranny. Plot3D[Sec[4 x]/y^3, {x, 1, 6}, {y, 1, 6}]] gives you this:
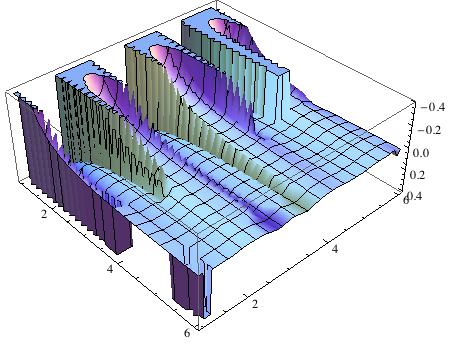
I wondered if I could find some combination of tangents, sines, and secants that would reproduce the contours of Talaya, Atalaya, and the other mountains I see from my eastern window. But I was already in over my head.
Not only can you see a function. You can hear it. In Wolframese, Plot[Sin[700 t + 100 t Sin[350 t]], {t, 0, 4}] means this:
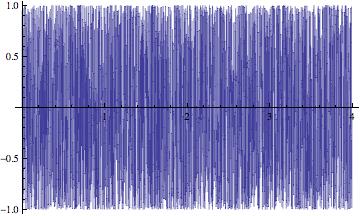
Replace “Plot” with “Play” and the image becomes a sound (Warning: Turn down the volume on your headset before pressing the button below.):
More germane to the purposes of The Santa Fe Review are Mathematica’s meteorological functions. Type in WeatherData[“KSAF”, “TotalPrecipitation”, {{1970, 1, 1}, {2009, 12, 31}, “Month”}] and Mathematica pulls in National Weather Service records of monthly precipitation at the Santa Fe Airport. I’d been looking for something like that for years. The Western Regional Climate Center has a page of historical measurements beginning in 1972. But midway through 2006 the updates inexplicably stopped. By importing the Mathematica data into a spreadsheet, I hoped to make a fuller range of information available.

Water molecule
I immediately ran into a problem, not with Mathematica but with the numbers it was getting from the weather service. According to its data, Santa Fe received 40 inches of rainfall in 1988 — and 45 inches in 1991 and 52.57 inches in 1994! This in a city where a good year might bring 12. (Maybe a corrupt database explains the suspiciously high normal rainfall figures in the New Mexican’s daily weather chart.) On the other hand, we’re informed, it didn’t rain a drop in Santa Fe from October 1981 until September 1984, a three-year drought that somehow hasn’t made it into the history books.
In search of better information, I reluctantly turned to the confusing labyrinth of a website run by the National Oceanic and Atmospheric Administration. Many clicks later I finally found historical records from 1932 through 2009. But there was a catch. This is government information paid for by taxes. By all rights it should be in the public domain. But NOAA wanted $100 for access. Through some weird fluke, I found that if I started with 1933 instead of 1932 the price fell to $40. So I put the item in my shopping cart and paid with a credit card.
Here’s what I got for the money, an unruly data dump that began like this:
	COOPID,WBNID,STATION NAME ,CD,ELEM,UN,YEAR,A,S,MO,DA,  JAN
	,F,F,MO,DA,  FEB ,F,F,MO,DA, MAR ,F,F,MO,DA,  APR ,F,F,MO,DA,
	 MAY ,F,F,MO,DA,  JUN ,F,F,MO,DA,  JUL ,F,F,MO,DA,  AUG
	,F,F,MO,DA,  SEP ,F,F,MO,DA, OCT ,F,F,MO,DA,  NOV ,F,F,MO,DA,
	 DEC ,F,F,MO,DA,ANNUAL,F,F
	------,-----,------------------------------,--,----,--,----,-
	,-,-
	-,--,------,-,-,--,--,------,-,-,--,--,------,-,-,--,--,-----
	-,-,
	-,--,--,------,-,-,--,--,------,-,-,--,--,------,-,-,--,--,--
	----
	,-,-,--,--,------,-,-,--,--,------,-,-,--,--,------,-,-,--,--
	,--- ---,-,-,--,--,------,-,- 298072,99999,SANTA FE
	,10,TPCP,HI,1933,9,9,01,00, 00073, , ,02,00, 00021, , ,03,00,
	00029, , ,04,00, 00080, , ,05,00, 00099, , ,06,00, 00230, ,
	,07,00, 00200, , ,08,00, 00190, , ,09,00, 00124, , ,10,00,
	00116, , ,11,00, 00102, , ,12,00, 00047, , ,13,99,-99999,M,
I wrestled with the gibberish until finally, 12 hours later, it succumbed. Here it is, the most complete record of Santa Fe rainfall and snowfall you’re likely to find: Santa Fe, New Mexico Monthly Precipitation, 1933 to 2009. You can also download my spreadsheet and the raw data. No one should have to buy this information again.
The measurements come from five different stations: Santa Fe (298072), Santa Fe 2 (298085), Santa Fe 7 SE (298087), Santa Fe Seton (298088), and Santa Fe 2 SE (298090). For unexplained reasons, the Santa Fe Airport (23049) isn’t included in the set. Maybe that is just as well since it was the source of the bad Mathematica data.
From the table I learned that the driest year has been 1956 with 6.68 inches. The wettest was 1965 with 20.71. The average from 1933 through 2008 was 13.56 inches. But during this decade it fell to 12.13. Through November 2009 we’ve had 9.68 inches. (That’s at the airport. My historical chart for the other locations runs only through July.) The snow last night was refreshing. But any way you parse the data, it will take a blizzard to make this even an average year.
George Johnson
The Santa Fe Review
