copyright 2005 by George Johnson
updated 3/16/05
Snow Day, 3/15/05, photo by George Johnson
1. Retrofit Arithmetic (and Rainbarrel Economics)
2. The San Juan-Chama Shell Game
3. The Case of the Disappearing Aquifer
4. The Creative Hydrology of Suerte del Sur
5. The City, the County, and a Water Tax Revolt
6. Water Numerology at City Hall
(Our story thus far)
7. The Woman at Otowi Gauge
8. "Forget it, Jake. It's Chinatown."
9. The Las Campanas Connection . . . desalination word games . . . and Aamodt South
(Our story continues)
10. The Engineering Solution
11. The Sorrows of San Acacio
12. The City's Dubious Water Report
March 15, 2005
13. Where the Water Went
I returned late last week from a trip to Patagonia and Tierra del Fuego -- what the early settler Lucas Bridges called "the uttermost part of the earth" -- to find the dams spilling over and the Santa Fe River surging from all the rain. The wettest winter on record, the papers said, and now another 13 inches of snow, as measured on top of the backyard trash can.
Just after landing in Punta Arenas, I received an email from Michael Rodriguez, a planner technician for the city of Santa Fe, acknowledging my request for documentation of the recent water calculations -- the ones showing per capita water use dropping last year to a record low -- and promising to deliver it, as mandated by state law, within 15 days. Like clockwork, on March 9, my last day in South America and the final day of the deadline, the city clerk's office called to say the information was ready. Clearly laid out and annotated, the color-coded spreadsheet was worth waiting for (click on it to see a larger view).
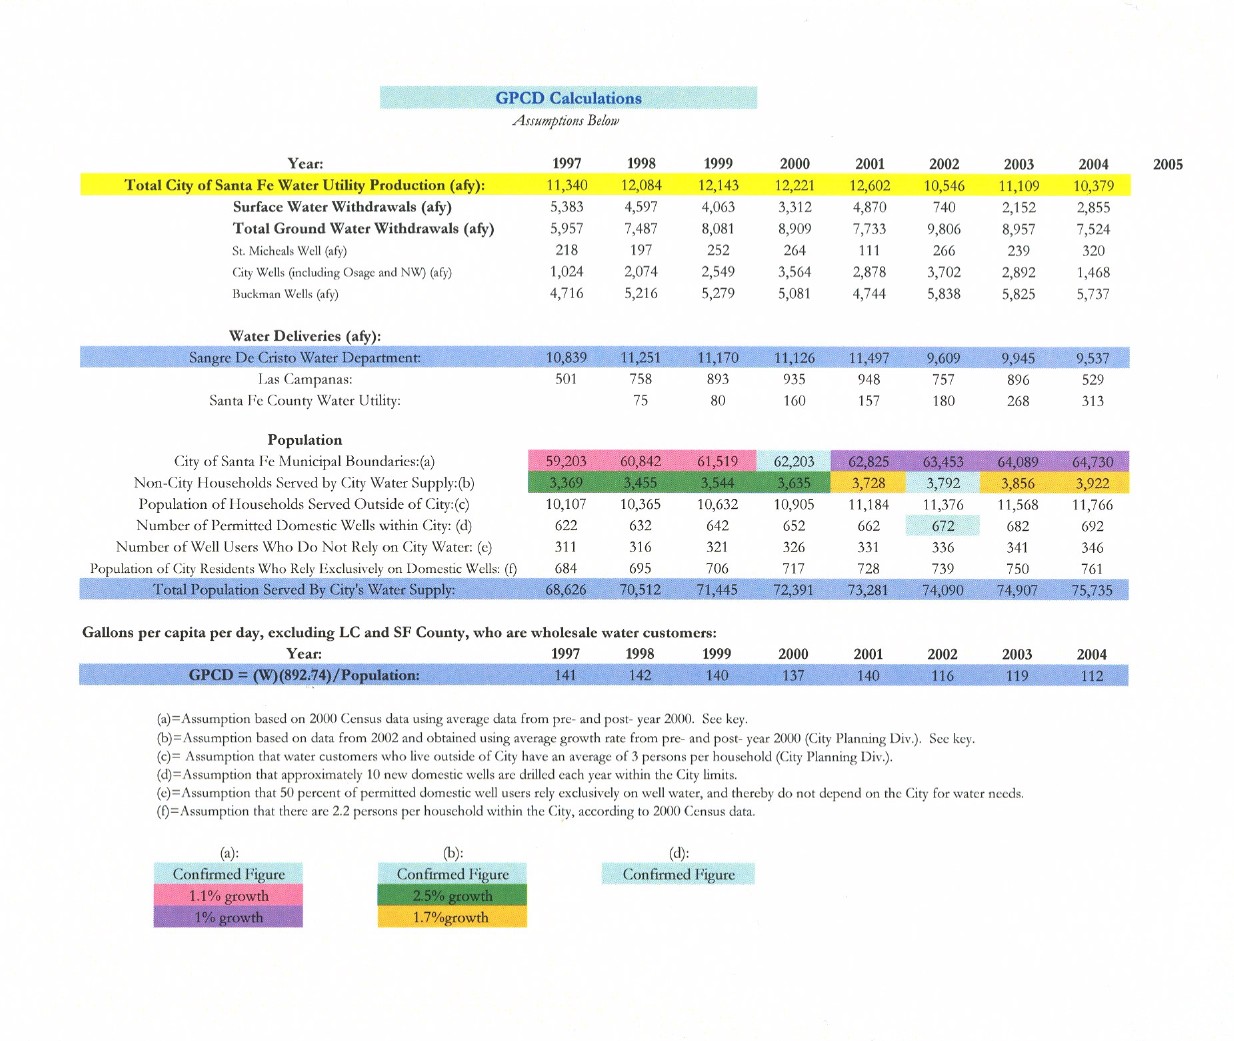
So here is what I had been missing: In calculating per capita consumption, city planners took the total water production from the wells and reservoirs (the yellow-shaded numbers), then subtracted what is sold in bulk to Las Campanas and the County Water Utility, leaving the figures on the first of the blue-shaded lines. That brought the 10,379 acre-feet for 2004 down to 9,537 -- the total amount of water going to metered customers. Then the analysts divided that figure by their best guess of how many people it might represent.
That is where things get tricky. The number of city water users was approximated by taking the population from the 2000 census, 62,203, and assuming that it has increased by 1% a year (the purple-shaded numbers). For 2004, that comes out to 64,730 city residents. For earlier years, 1997 to 1999, the planners extrapolated backwards (the pink numbers), this time assuming a slightly faster, 1.1% annual growth rate.
That much is fairly straightforward. What throws a wrench into the works is the small but significant number of people, just beyond the city limits, whose homes are also connected directly to the municipal water mains. Since they are not included in the city census figures, their number had to be reckoned using an entirely different approach. According to an estimate by the Planning Division, there were 3,792 of these additional households in 2002, and a block by block survey found there was an average of three people in each. Here too the figures for other years had to be extrapolated, this time assuming a 1.7% growth rate for 2001 to 2004 (the orange numbers) and a 2.5% rate for 1997 to 2000 (the green ones).
Finally, the city used data from the State Engineer and more projections to cull out the approximate number of residents relying solely on their own wells. (This caused the previous per capita estimate of 111 gallons a day for 2004 to increase slightly to 112.)
Like any model, this one is filled with assumptions and methodologies over which reasonable people can disagree. Population in the county certainly grows faster than within the city limits, but did the number of nonresidential customers really increase at so fast a pace? And can we be confident that the number of people per household in this group is really 3 and not 2.4 -- as it is for the county as a whole? Anything that inflates the population of water users will appear to lower per capita consumption.
But such are the hazards of the modeling game, and there is no reason to take this as anything less than an honest, professional effort to quantify how much water Santa Feans are taking from the wells and streams. It's how the results have been used politically that is hard to defend. What the figures do not do is provide support for the Delgado administration's contention that, because of retrofitting, new development is using no additional water. Establishing that would require adjusting for fluctuations in precipitation and tourism -- the two most important factors in determining how much water the city consumes.
So let's make our own chart. Rainfall figures are readily available. For tourism, we can take the lodging tax receipts reported each year by the city (levied at 4 percent in 1997, rising to 5 percent in 2002, and 6 percent in February 2004) and back out the total amount visitors spent each year on hotel and motel rooms.*
What is most striking is how per capita water consumption stays essentially the same in 2000 and 2001, despite a large fluctuation in rainfall, then drops off a cliff in 2002. The retrofit ordinance can't have anything to do with that -- it was passed in the fall of that year and took months to implement. But look how money spent on lodging (expressed here in thousands of dollars) took a dive. The reason of course was the tragedy of 9/11.
In 2003 there was a moderate rebound in tourism, a big drop in precipitation, and, predictably, a rise in water use. Consumption was still pretty low, suggesting that by now retrofits -- along with watering restrictions and a decision to let the parks die -- were helping to soften the impact.
Last year tourism dropped again while rainfall rose to its highest level in four years, a fortuitous convergence that brought water consumption to the much celebrated new low of 112 gallons per person per day. But the credit city hall wished to claim in releasing that news might better be given to the weather gods, and to the spike in gasoline prices and the stagnant economy that kept the tourists away.

Coming soon: The Solitude Tax
The Santa Fe Review

If you would like to be on the email list (or wish to be deleted), please write to the above address.
More links:
Santa Fe water information, a collection of documents and links